The History of Ofgem’s Energy Price Cap
There is currently an Energy Price Cap managed by the industry regulator Ofgem that caps the price of electricity for an average user of gas and electricity. The unit rates and standing charges change quarterly.
What are the current energy price cap rates?
Current Energy Price Cap Rates 1st April 2024 – 30th June 2024
- Average dual fuel bill: £1,690 (-12.4%)
- Electricity unit rate: 24.50p/ kWh (-14.4%) plus 60.10p/ day (+12.7%)
- Gas unit rate: 6.04p/ kWh (-18.6%) plus 31.43p/ day (+6.2%)
Previous Energy Price Cap Rates 1st January 2024 – 31st March 2024
- Average dual fuel bill: £1,928 (+5.2%)
- Electricity unit rate: 28.62p/ kWh (+4.6%) plus 53.37p/ day (+0.0%)
- Gas unit rate: 7.42p/ kWh (+7.7%) plus 29.62p/ day (+0.0%)
Rates vary by region with East Midlands the cheapest, and North Wales the most expensive.
What is the energy price cap and when was it introduced?
An energy price cap limits the maximum price that a supplier can charge its customers per unit of energy used. It also sets a maximum daily standing charge (the cost of connecting your home to the national grid). However, the price cap never limits your total energy consumption; if you use more, you pay more than the set limit. The set rates were introduced in January 2019 by regulatory body, Ofgem, and reviewed every six months.
Why was it introduced, and how does the energy price cap work?
Ofgem introduced the cap to help homeowners avoid having to fork out on extortionate bills, and to prevent suppliers from making excessive profits from consumers. In addition, the rate intended to limit costs associated with the most expensive rates on standard and default variable tariffs.
However, as market prices soared, rate differentials narrowed on the whole, giving homeowners no clear cheaper option — exposing the first flaw of the cap: when prices go up, the cap rate follows.
What does the latest cap increase mean for households?
The energy price cap does not affect prices in domestic properties. At the present time, the Energy Price Guarantee limits what energy companies charge their customers. Just for information, below are the current and previous energy price cap rates.
Current standard daily charges and 2024 rates
| Energy | Previous rate (ending March 2024) | Today’s rate (1st April 2024 onwards) |
| Gas | Unit rate: 7.42p per kWh (+7.7%) Standing charge: 29.60p per day (+0.0%) |
Unit rate: 6.04p per kWh (-18.6%) Standing charge: 31.43p per day (+18.6%) |
| Electricity | Unit rate: 28.62p per kWh (+4.6%) Standing charge: 53.35p per day (+0.0%) |
Unit rate: 24.50p per kWh (-14.4%) Standing charge: 60.10p per day (+12.7%) |
Note: The figures in brackets represent the percentage change on the previous quarter.
The cap decreases are largely as a result of lower wholesale energy costs. Wholesale energy prices are lower as a result of global and local issues. Moving into the summer months usually sees a reduction in energy prices due to lower demand.
Previous issues closer to home include lower wind levels, which have led to lower renewable energy generation. An outage at a National Grid site in Kent knocked out a power cable that runs between England and France. The UK also has some of the lowest gas reserves in Europe, which means there is almost no way of stockpiling gas to use when needed.
The cap accounts for both fuels, but respectively, gas costs have increased by 81% whereas electricity rates have jumped by 36%. Around 23 million homes in the UK are heated by gas boilers, favoured as the cheaper, more convenient option. The changing cap rates could trigger a shift amongst homeowners though, and many may consider switching to electric heating.
While there might be savings to be had in the long run by changing to electric heating, there are still initial expenses that won’t amount to any significantly lower monthly bills than the figures we can expect to see from the new capped gas rate.
For homeowners who want to make the change, investigating tariff options is key. On certain tariffs, and depending on when you use your heating, savings may be possible. However, customers are once again stuck with no clear advantage — over time and because of market climate and future cap rates, bills may not stray much at all from the proposed new figure.
With genuine concern around the rise of fuel poverty, various government-backed rebate schemes were actioned. These are detailed below.
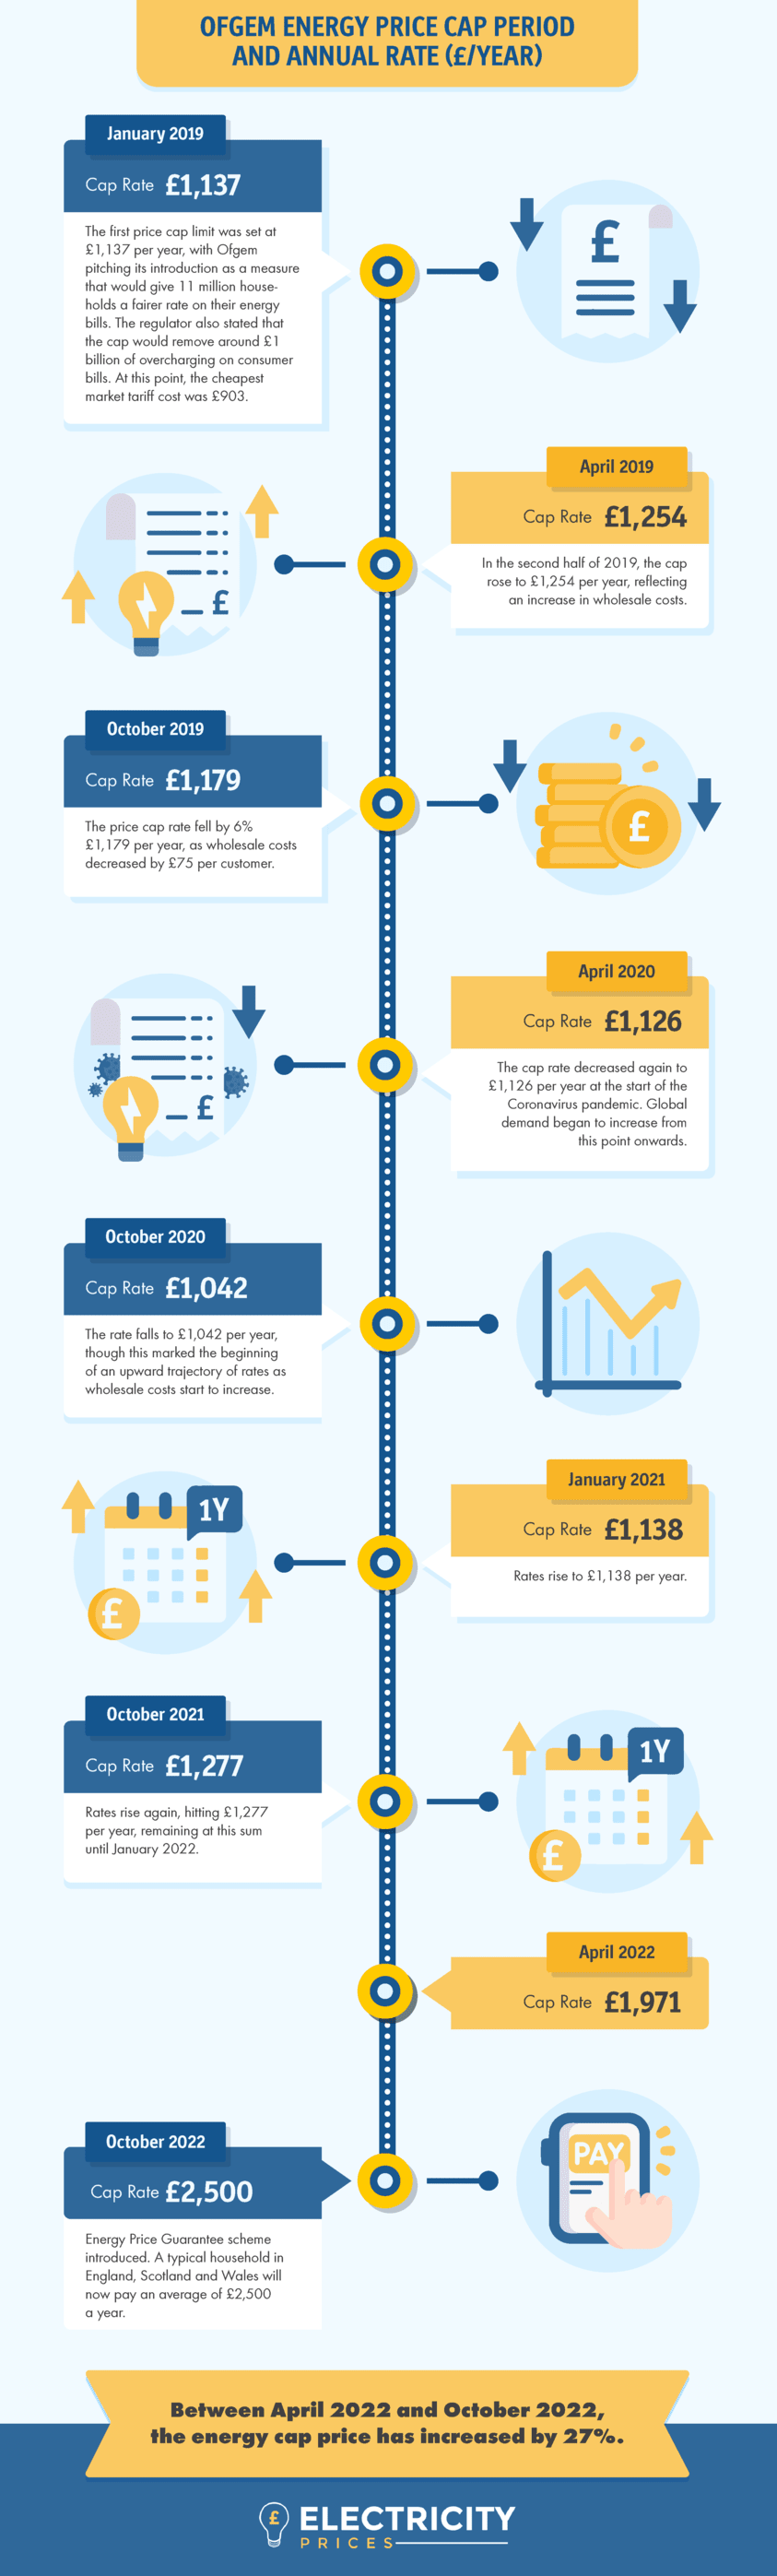
The Ofgem energy price cap history & timeline
Throughout the energy price cap history, no rate increase has taken as steep of an incline as the April 2022 announcement.
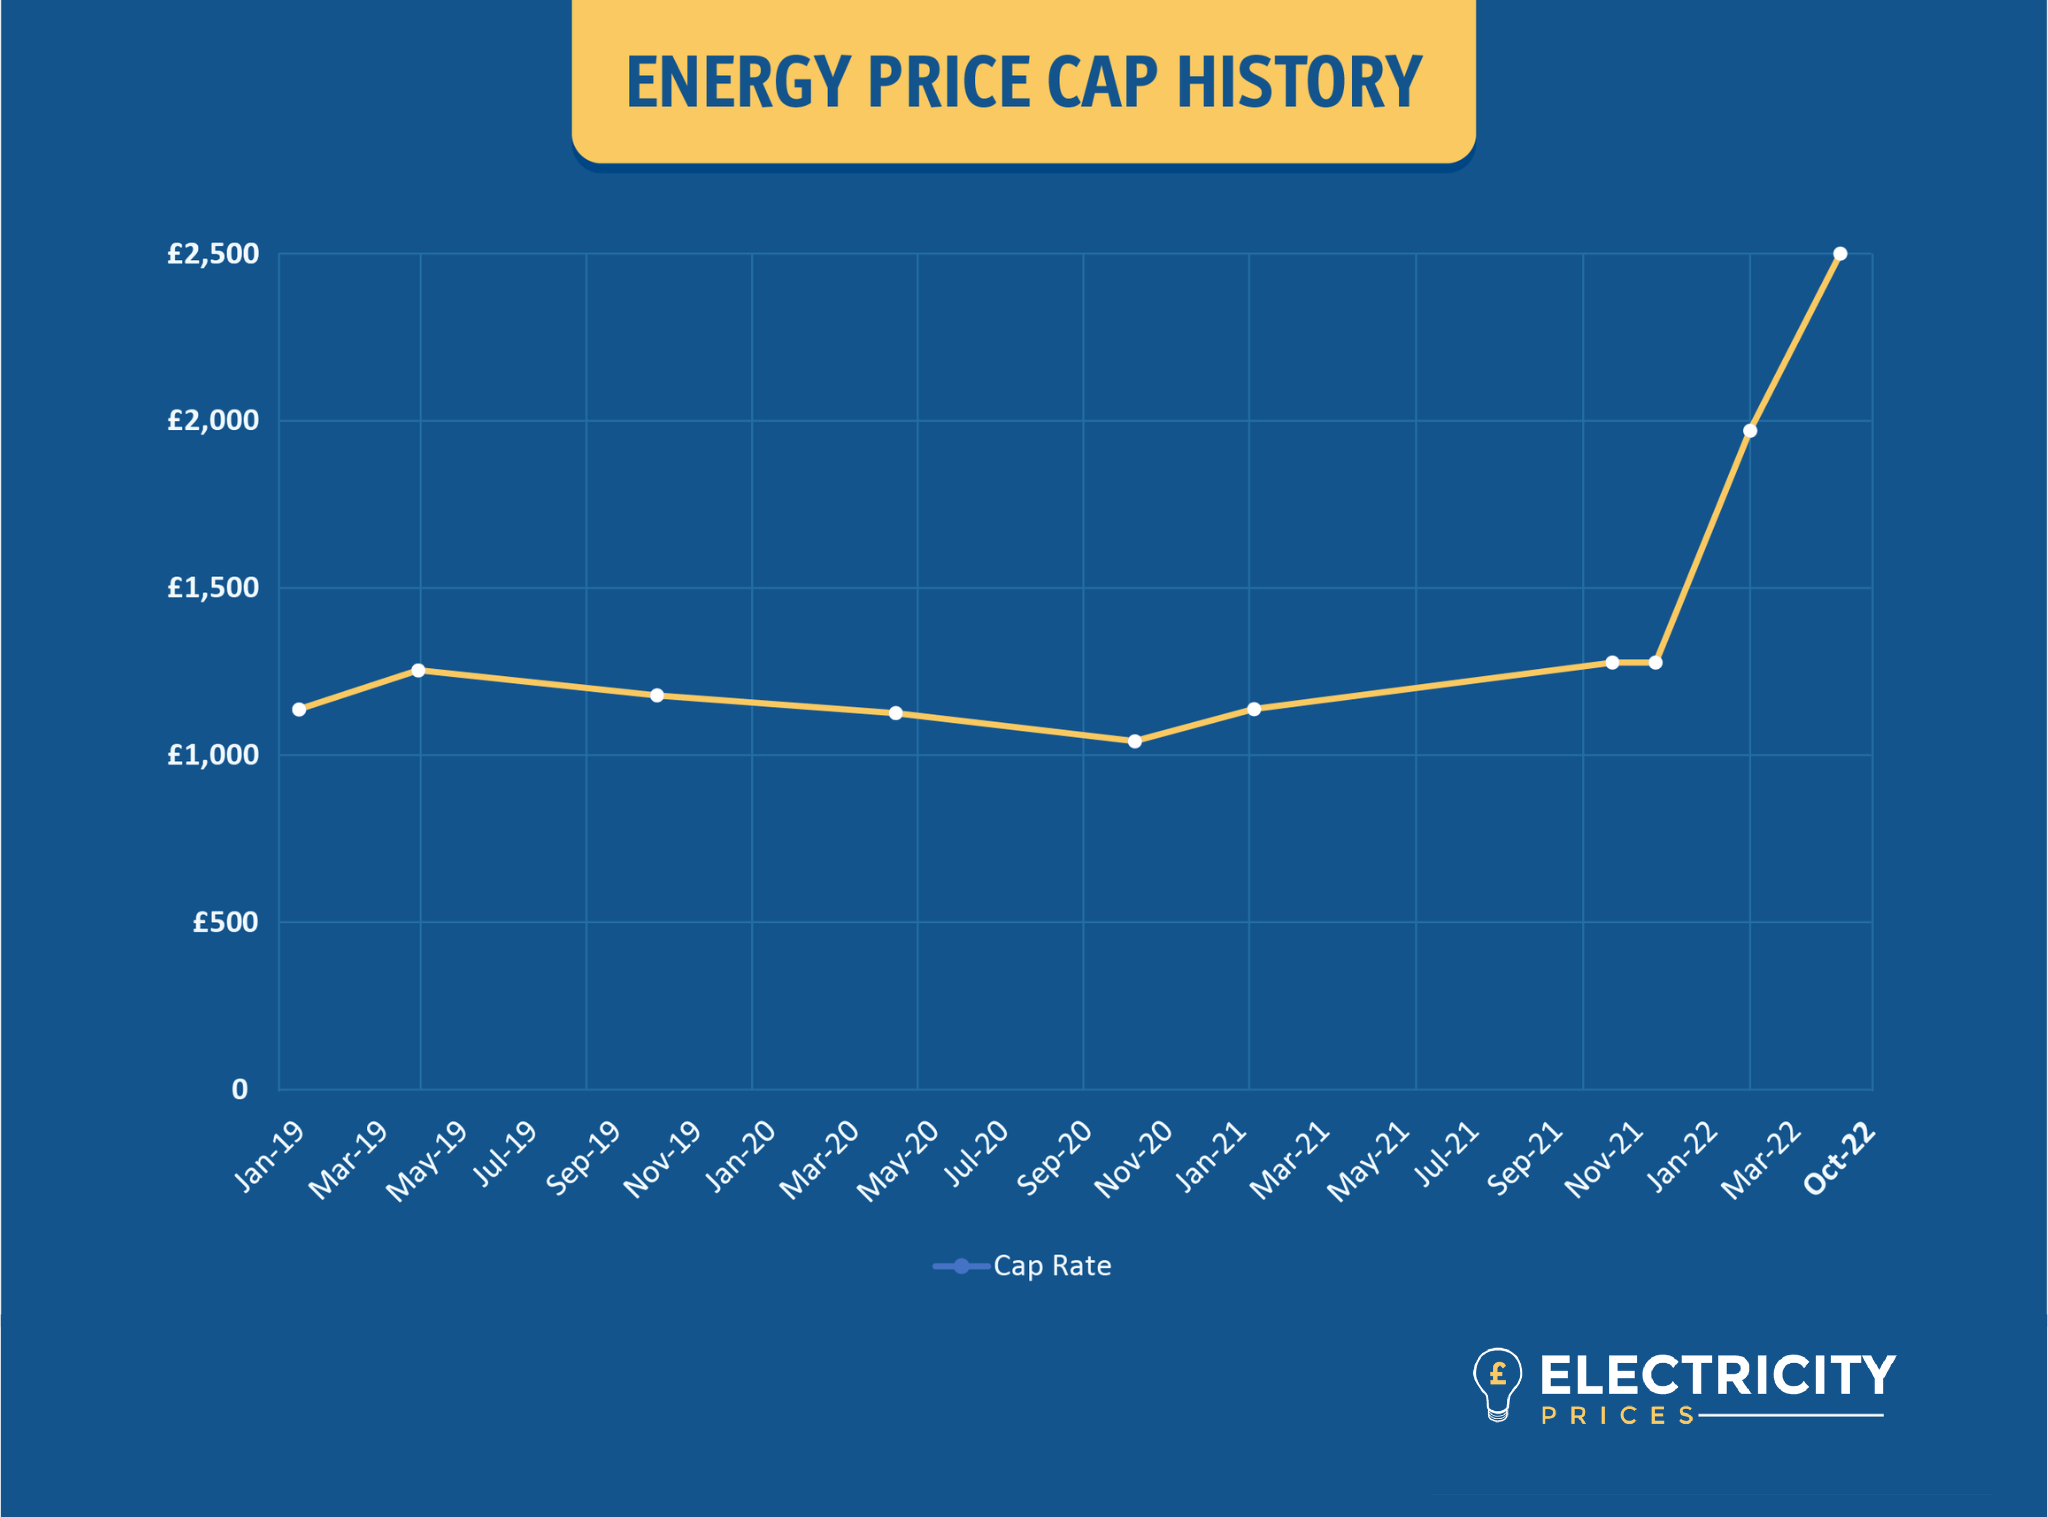
Ofgem energy price cap period and annual rate (GBP p/year)
| Cap period start | Cap Rate | EPG Rate |
| January 2019 | £1,137 | N/A |
| April 2019 | £1,254 | N/A |
| October 2019 | £1,179 | N/A |
| April 2020 | £1,126 | N/A |
| October 2020 | £1,042 | N/A |
| January 2021 | £1,138 | N/A |
| October 2021 | £1,277 | N/A |
| January 2022 | £1,277 | N/A |
| April 2022 | £1,971 | N/A |
| October 2022 | £3,529 | £2,500 |
| January 2023 | £4,279 | £2,500 |
| April 2023 | £3,280 | £2,500 |
| July 2023 | £2,074 | N/A |
| October 2023 | £1,834 | N/A |
| January 2024 | £1,928 | N/A |
| April 2024 | £1,690 | N/A |
Critics of the price cap have called it a ‘halfway house’ of sorts, serving only a niche group of consumers and the governing bodies which have enacted it. It could be argued that the cap has distorted the market, based on the fact that when the cap was first introduced, prices fell dramatically between April 2019 and October 2020. When the price cap rose in January 2021, the cheapest market deals weren’t far off the capped rate of £1,138. These unrealistically low prices supported the agenda that customers were getting a good deal, and now that prices have soared, the price cap simply follows.
Should the cap remain in place?
Cap rates have taken customers on a rollercoaster ride — even if a household uses less energy, they’re still roped into paying the daily rate, while suppliers have created the perception that fair deals do exist. Without the cap, regulatory bodies and governments could once again be faced with the issue of tackling providers profiting excessively from bill payers. As we veer towards a crisis in cost of living, with or without a price cap in place, authorities would have to find substantial ways to cushion households from the looming rate hike.
Government Energy Rebates
In addition to the price guarantee, various government credits supplemented consumer bills.
- £200 credit per meter if you used an alternative fuel to gas (for example, LPG, Oil) – credited February 2023.
- £400 energy bills support scheme per meter – credited over six months from October 2022.
A winter fuel payment for people of pensionable age also continued.
Energy Price Cap FAQs
Should I switch suppliers before the new energy price cap rates begin?
Despite the fact that switching tends to help customers avoid price hikes and secure better deals, the nature of the market means that there’s no guarantee of savings. If you’re still keen to switch, consider how much costlier a new tariff would be than your current rates and factor in the average amount of time it takes to switch — typically, 17 days.
What happens if my current energy supplier goes bust?
Ofgem has a responsibility as a regulatory body to protect customers from unforeseen circumstances, such as in the event a provider enters liquidation. Your energy supply will not be interrupted in this occurrence.
Is the cap likely to change again in 2024?
Cornwall Insight are anticipating further price changes as wholesale energy costs remain volatile, though this is not certain. Wholesale prices depend on the market and levies on firms, and Ofgem has no control over these aspects.
Additional data sources
Ofgem support paying bills
Moneysavingexpert price cap summary